
In a couple of weeks time on 15 September 2013, I’ll be running the Great North Run – a half marathon. When I tell people this, I often get asked ‘why?’.
To start with I struggled to explain my motivation. There is something about personal achievement of course. Up until May last year, I had never ever run before. When I finished my Masters research project, I decided that a different sort of ‘project’ would be to see if I could run. I used a “Couch to 5k” app on my phone to gradually build up the time and distance I ran and after nine weeks I could do it – 30 minutes of running, roughly 5km. I enjoyed it so much I continued and my sunday runs gradually got longer. In the August, Alex started out on his couch to 5k journey too. And then at Christmas we said to each other – shall we do the GNR together? We applied, we got places, we’ve trained together all summer…and here we are two weeks away.
But, a lot of people expect me to reply to the ‘why’ question with a charitable cause in mind. I’ve thought about this a lot – round and round in circles about something I really care about. And, I’ve kept coming back to one conclusion
I’m running…Because more equal societies work better for everyone
This is the strapline of the Equality Trust I don’t necessarily want to raise loads of money for them, but I do want to draw attention to their research and get more people thinking about what it means for how we think about wellbeing and health. It is of course explicitly connected to my work – but the more I do that work, the more I realise how important fairness is to me personally too.
Let’s show you some statistics that I think illustrate the issues well…
When the Marmot Review (Fair Society, Healthy Lives: review of health inequalities in England post 2010) [more info at http://www.instituteofhealthequity.org] was published – the graph that grabbed everyone’s attention was this one (you can click to enlarge)
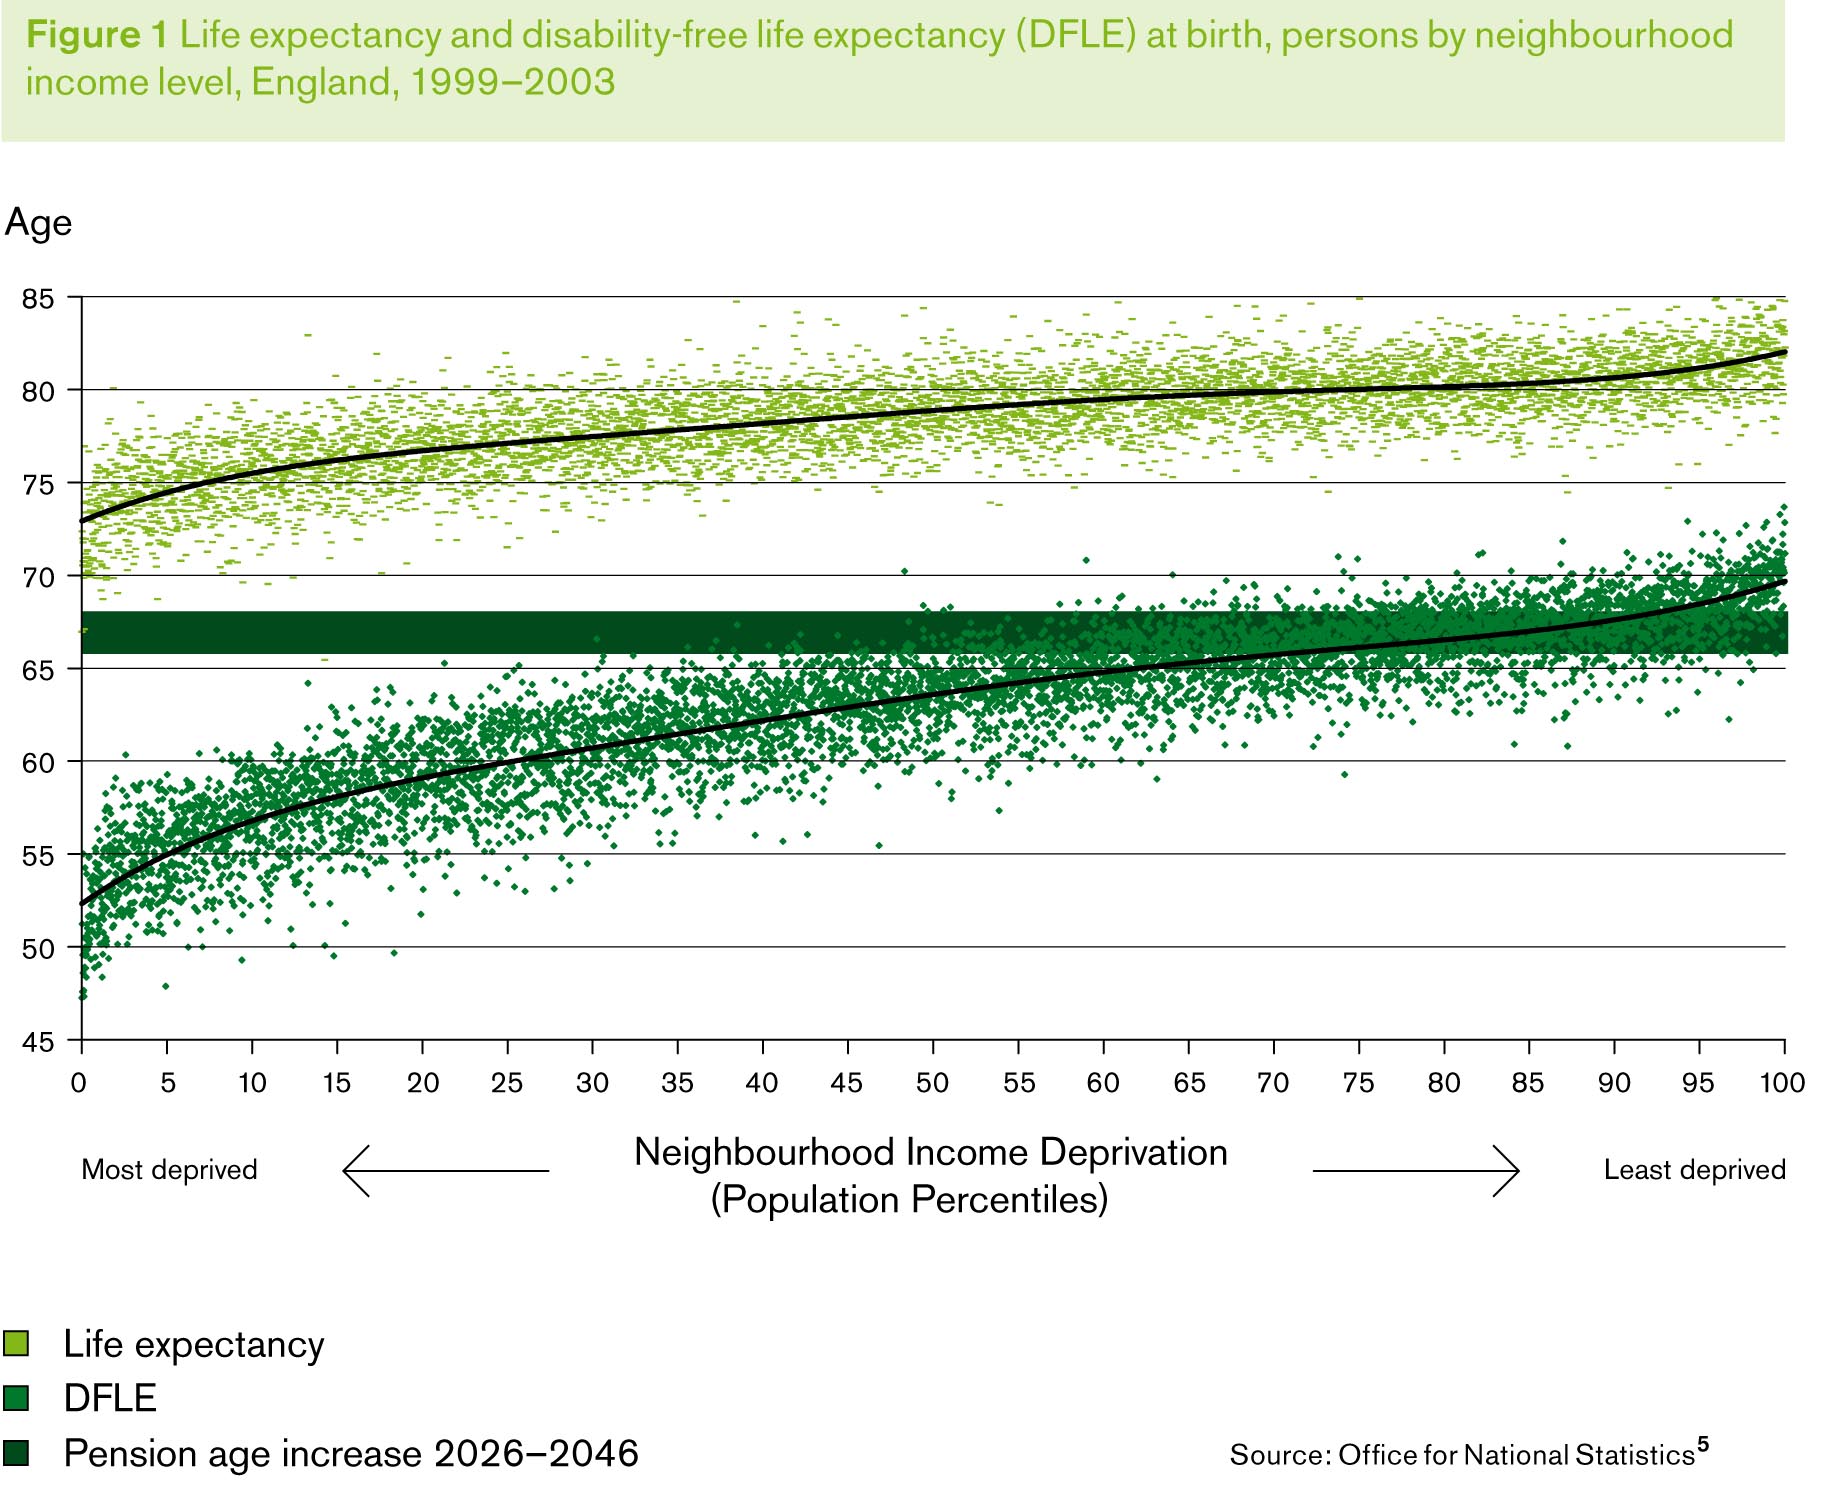
Source: Fair society, healthy lives: The Marmot Review
It grabbed people’s attention because it demonstrated that not only do people in poorer areas live shorter lives, they also live a greater proportion of their shorter lives with an illness or disability. It also demonstrates that a huge chunk of the population will have an illness or a disability before state-retirement age.
I have no idea which of the little dots represents the neighbourhood I am part of but I do know some of the areas at the low end are not very far from home – and what strikes me is that the y-axis starts at age 45. That means some people not too far from where I live have an illness or disability that means they can’t just go out and start running ‘at my age’ (can’t give too much away!) – they’d have to check in with their doctor perhaps or build up a lot more gradually. I even took it for granted that I could buy good running shoes that minimise risk of injury and hi-vis gear so I could carry on running safely through the winter months – that’s not so easy for those on low incomes.
And as for life expectancy…
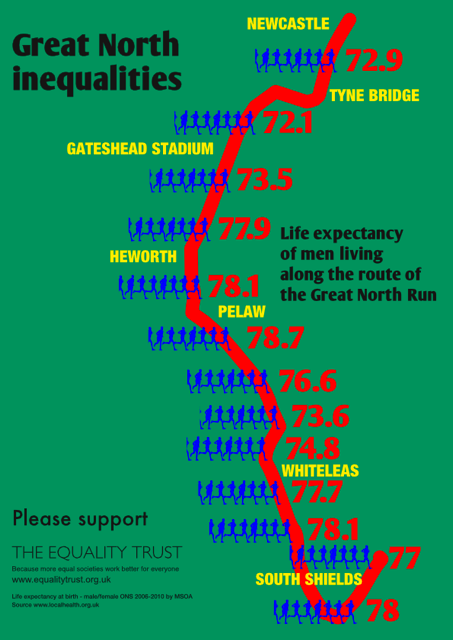
The Great North Run route travels through three local authority areas – Newcastle, Gateshead and South Tyneside. All of these areas have a lower life expectancy than the English average.
For men:
- In England average life expectancy is 78.3 years.
- In Newcastle it is 76.4 years
- In Gateshead it is 76.4 years
- In South Tyneside it is 76.5 years
But look more closely and you see that there are inequalities – even in the space of 13 miles.
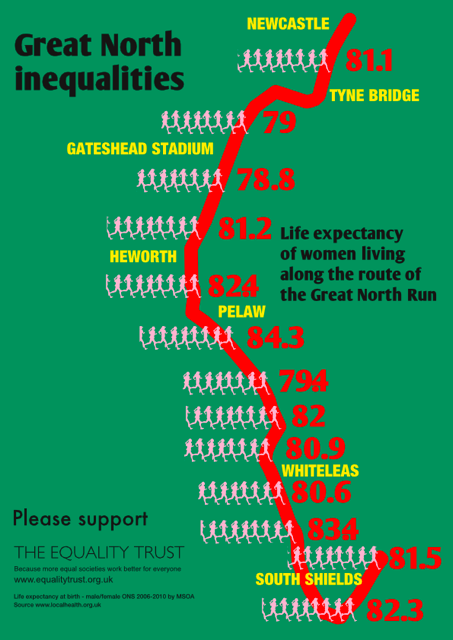
And for women
- In England average life expectancy is 82.3 years.
- In Newcastle it is 80.9 years
- In Gateshead it is 80.8 years
- In South Tyneside it is 80.7 years
So here we are with the ‘why’ question again. A common explanation is differences in lifestyles – in smoking rates, in physical activity, in consumption of alcohol or healthy food – this makes us talk about ‘personal responsibility’ and the need for ‘health education’. But lifestyles differences do not wholly explain these differences – and unhealthy lifestyles themselves can be understood as a behavioural response to the stresses of disadvantage. (See the great WHO publication Social Determinants of health: the solid facts)
The more we ask ‘why’, the more we drill into the causes of the causes of the causes – the environmental determinants, the social determinants, the commercial determinants, the political determinants – a society with an unequal distribution of money, power and resources. That’s what the Equality Trust’s research aims to highlight and bring into public consciousness – and it’s not just measures like life expectancy that we traditionally associate with health – it embraces lots of societal issues – crime, child wellbeing, educational attainment, even links to climate change.
So as I do my Great North Run, I invite you to read the research at http://www.equalitytrust.org.uk/ and if you want to use their ‘Donate’ facility please support the campaign. You can also help by spreading the word through your family and networks by making them aware of this blog post.
Sources and Acknowledgements
All life expectancy figures are sourced from www.localhealth.org.uk and are based on 2006-2010 life expectancy at birth statistics Office for National Statistics.
With thanks to Val Corris for the crash-course in sourcing life expectancy figures and to Martin Gollan for his work on the infographics
How was the run? Congratulations for taking on this challenge. Kind regards,
16 September 2013
Hooray. Alex and I managed the run in 1 hour 54 min and 2 seconds. Feeling very pleased with myself.
Helen